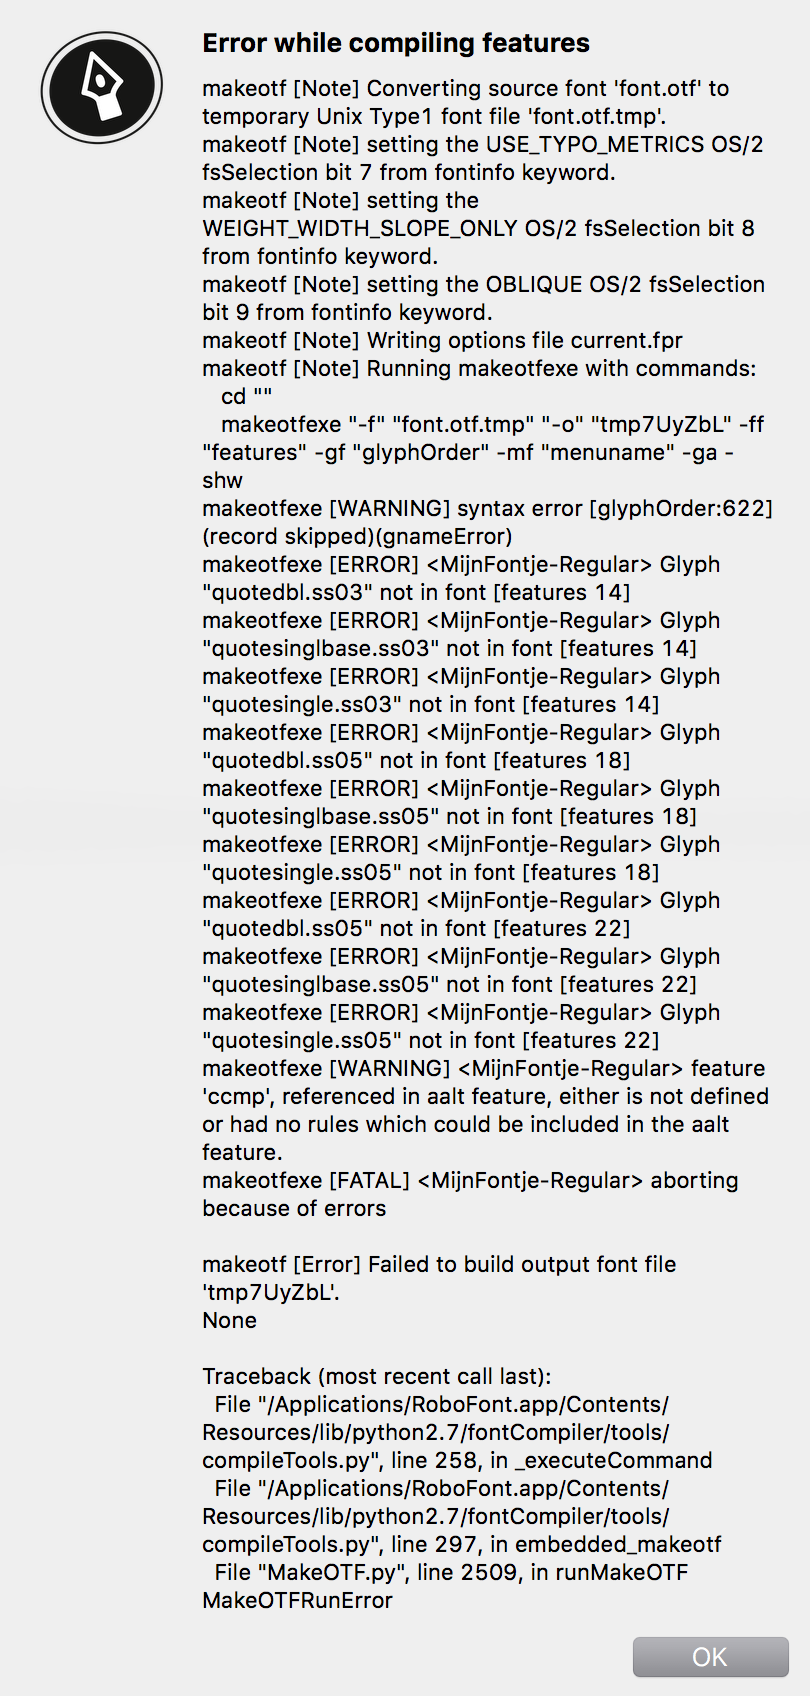
I recently tried to debug some OT feature code within Glyphs, but I was quite disappointed by some of the error messages. When compiling the same file with Robofont, I ended up with getting a far more informative message.
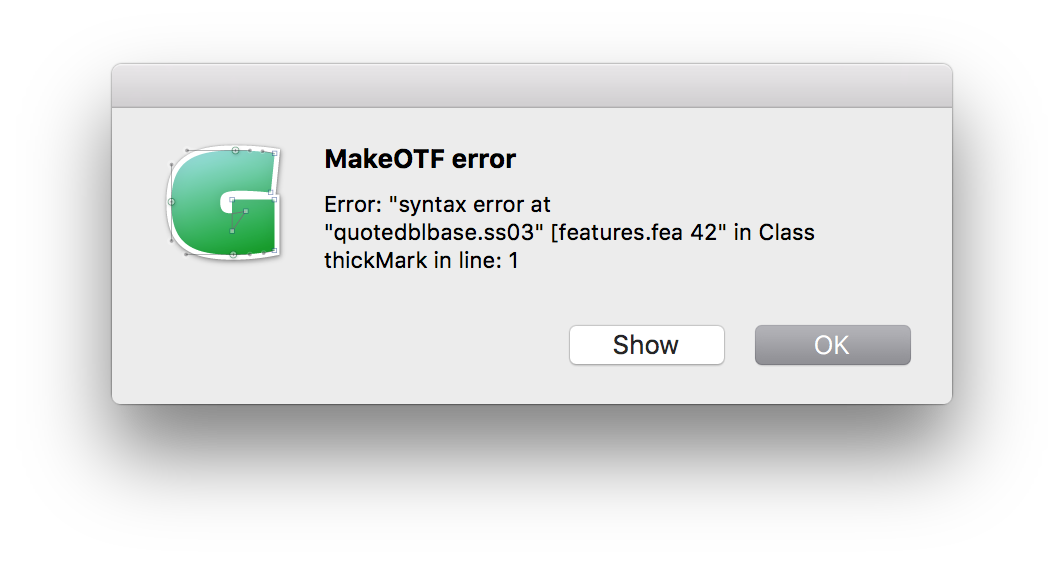
Glyphs tries to only show the part that is the actual problem. And it did that just fine in this case. It recalculates the line numbers to match the line numbers in the feature panel.
If you need the full error message, you can run the ‘generatFont.comand’ from the Temp folder. There you also find the full ‘feature.fea’ file.
I would also find it helpful if there was the option for more verbose error messages.
Yesterday, I’d ended up with several glyphs that had the same production names (after duplicating glyphs, I hadn’t thought to check ‘info for selection’, assuming it would revert). When exporting, Glyphs would generate an error for only the first one it hit, meaning I had to try exporting a dozen times to know which glyphs were affected to be able to fix them.
It shows the program’s problem, but not the user’s. While the program is happy with a “syntax error”, I as a user have a hard time figuring out that there are actually some glyphs missing.
Would it be possible to have a “Details” button or something like that to displaying the raw error code, like in Robofont?
We are thinking about it. In the meantime please use the command method described by Georg. Tip: For debugging, I keep a link to the Temp folder in the Finder sidebar.