chingru
(ChingRu)
1
Hi there,
I’m developing a script which need to drawing shape with bezier curve.
I’ve found that this code can draw a rectangle or other goemartic shape with lines:
coords = ([0, 0], [0, 10], [10, 10], [10, 0])

newline = GSPath()
for idx, xy in enumerate(coords):
	newnode = GSNode()
	newnode.type = GSLINE
	newnode.position = (xy[0], xy[1])
	newline.nodes.append(newnode)
newline.closed = True

thisLayer.shapes.append(newline)
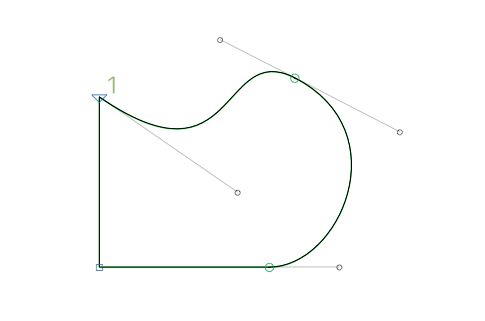
but how about this kind of shape that has handle control point (CURVE, QCURVE and OFFCURVE) ? How can I draw it with script/python?
Thanks for help.
chingru
(ChingRu)
2
Good news, I found this method, it works fine for me.
mekkablue
(Rainer Erich Scheichelbauer)
3
Actually better to use a pen. I’ll post a sample later.
chingru
(ChingRu)
4
Could you show a demo about coordinates to Bezier curve?
Thank you.
mekkablue
(Rainer Erich Scheichelbauer)
5
Look at the Build scripts of the mekkablue scripts.