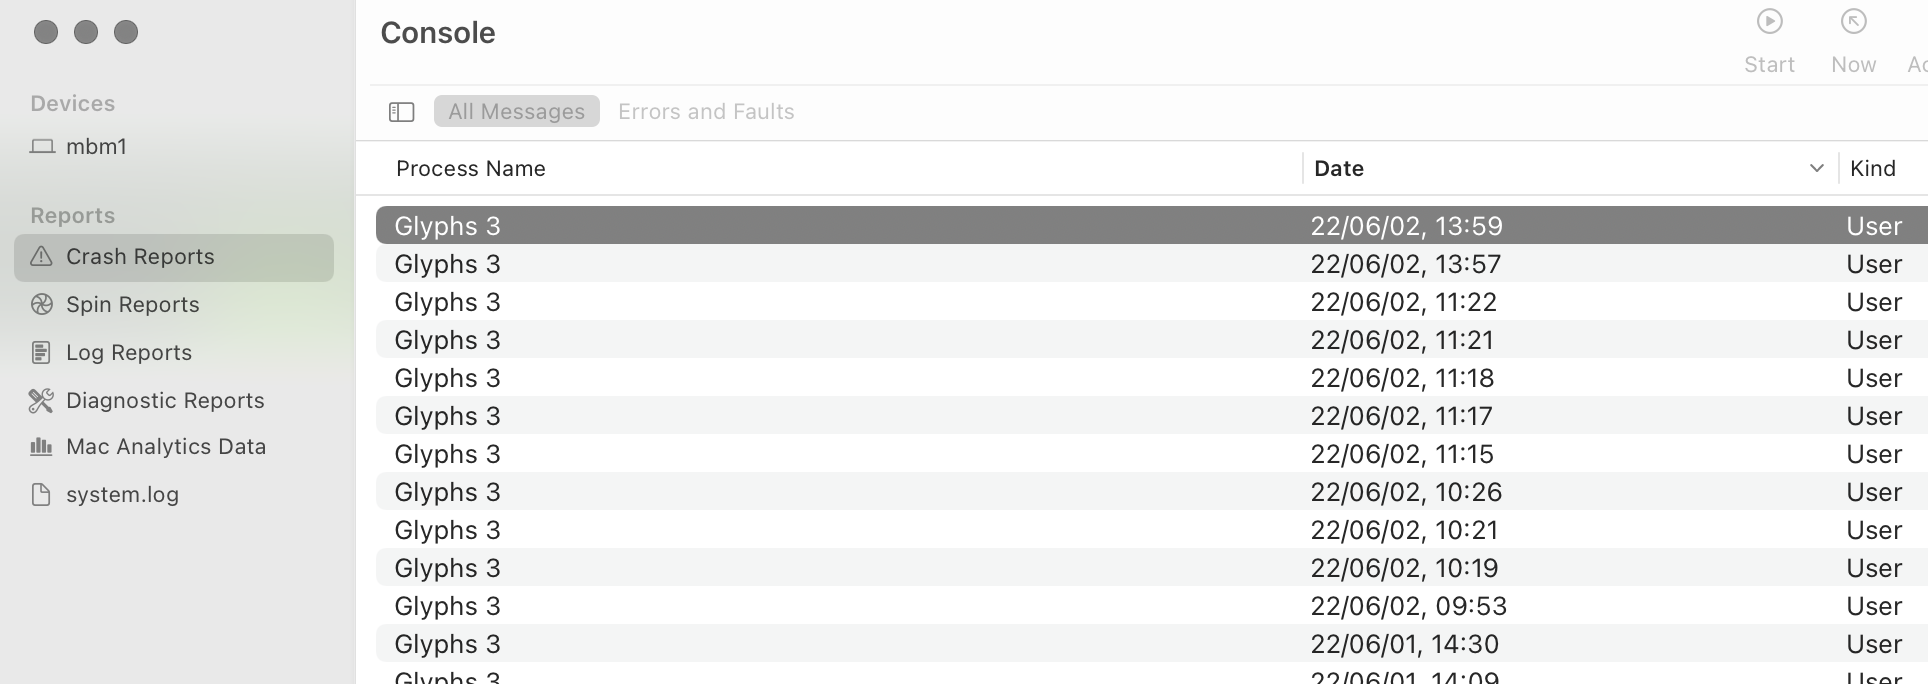
The past two days I’ve experienced a rather high frequency of crashes, ofthen while doing mundane things like selecting a handle or nudging an anchor. Scanning through the crash logs, every single crash is from memory violation originating in Python’s visit_decref .
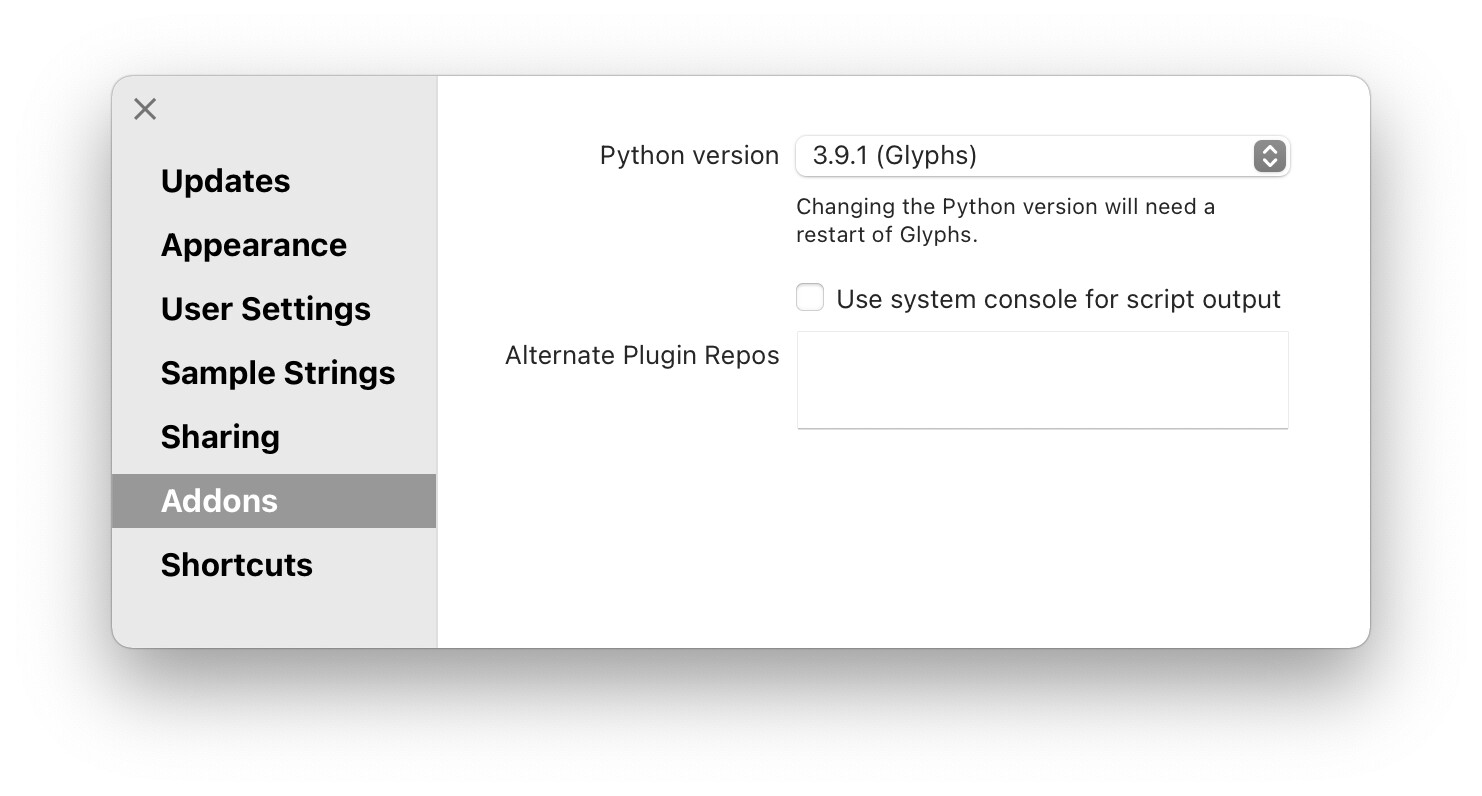
I’m using the Python that ships with Glyphs:
What I’m doing this afternoon is to use Glyphs without any plugins to see if it still crashes. (It’s unfortunate that there’s no stack state for plugins in the crash logs since they are Python scripts. I wonder if Glyphs perhaps records Python crash information somewhere?)
Here is a collection of crash logs from today:
glyphs-crashes-jun2.zip (68.9 KB)
(I’ve submitted a few of these using the build-in reporter with some additional instructions.)
Here’s one of the stack traces from a crash:
0   Python                        	       0x1178f3198 visit_decref + 16
1   Python                        	       0x1177f7ef0 dict_traverse + 300
2   Python                        	       0x1177f7ef0 dict_traverse + 300
3   Python                        	       0x1178f0fc8 collect + 572
4   Python                        	       0x1178f1f10 _PyObject_GC_Alloc + 392
5   Python                        	       0x1178f1f6c _PyObject_GC_New + 28
6   Python                        	       0x1177f2b34 PyDict_New + 92
7   Python                        	       0x1177fa458 _PyObjectDict_SetItem + 164
8   Python                        	       0x117809970 _PyObject_GenericSetAttrWithDict + 304
9   Python                        	       0x117808cb8 PyObject_SetAttr + 132
10  Python                        	       0x11789060c _PyEval_EvalFrameDefault + 12636
11  Python                        	       0x1177c3dd4 function_code_fastcall + 112
12  Python                        	       0x1177c3404 _PyObject_FastCallDictTstate + 272
13  Python                        	       0x1177c40dc _PyObject_Call_Prepend + 148
14  Python                        	       0x117824ff8 slot_tp_init + 216
15  Python                        	       0x11781c048 type_call + 352
16  Python                        	       0x1177c35dc _PyObject_MakeTpCall + 360
17  Python                        	       0x1178956b4 call_function + 512
18  Python                        	       0x117893048 _PyEval_EvalFrameDefault + 23448
19  Python                        	       0x1177c3dd4 function_code_fastcall + 112
20  Python                        	       0x1177c3404 _PyObject_FastCallDictTstate + 272
21  Python                        	       0x1177c40dc _PyObject_Call_Prepend + 148
22  Python                        	       0x117824ff8 slot_tp_init + 216
23  Python                        	       0x11781c048 type_call + 352
24  Python                        	       0x1177c35dc _PyObject_MakeTpCall + 360
25  Python                        	       0x1178956b4 call_function + 512
26  Python                        	       0x117893048 _PyEval_EvalFrameDefault + 23448
27  Python                        	       0x1177c3dd4 function_code_fastcall + 112
28  Python                        	       0x117895654 call_function + 416
29  Python                        	       0x117892fa8 _PyEval_EvalFrameDefault + 23288
30  Python                        	       0x1178965a4 _PyEval_EvalCode + 3032
31  Python                        	       0x1177c3d58 _PyFunction_Vectorcall + 256
32  Python                        	       0x117895654 call_function + 416
33  Python                        	       0x117892fa8 _PyEval_EvalFrameDefault + 23288
34  Python                        	       0x1177c3dd4 function_code_fastcall + 112
35  Python                        	       0x1177c5d5c method_vectorcall + 168
36  Python                        	       0x117895654 call_function + 416
37  Python                        	       0x117892fcc _PyEval_EvalFrameDefault + 23324
38  Python                        	       0x1177c3dd4 function_code_fastcall + 112
39  _objc.cpython-39-darwin.so    	       0x1203fe130 method_stub + 1212
40  libffi.dylib                  	       0x1a2284e24 ffi_closure_SYSV_inner + 808
41  libffi.dylib                  	       0x1a227c1e8 ffi_closure_SYSV + 56
42  Glyphs 3                      	       0x1022e3a14 0x1021e4000 + 1047060
43  Glyphs 3                      	       0x1022af1c4 0x1021e4000 + 831940
44  AppKit                        	       0x196f6b584 _NSViewDrawRect + 148
45  AppKit                        	       0x1976a1af0 -[NSView _recursive:displayRectIgnoringOpacity:inContext:stopAtLayerBackedViews:] + 1312
46  AppKit                        	       0x196f6ad08 -[NSView(NSLayerKitGlue) _drawViewBackingLayer:inContext:drawingHandler:] + 676
47  AppKit                        	       0x196f6a9a8 -[NSView(NSLayerKitGlue) drawLayer:inContext:] + 320
48  QuartzCore                    	       0x19b1208f8 CABackingStoreUpdate_ + 496
49  QuartzCore                    	       0x19b17f778 invocation function for block in CA::Layer::display_() + 64
50  QuartzCore                    	       0x19b11fb68 -[CALayer _display] + 1768
51  AppKit                        	       0x196f6a778 -[_NSBackingLayer display] + 372
52  AppKit                        	       0x196ee3838 -[_NSViewBackingLayer display] + 648
53  QuartzCore                    	       0x19b11ec70 CA::Layer::display_if_needed(CA::Transaction*) + 776
54  QuartzCore                    	       0x19b26139c CA::Context::commit_transaction(CA::Transaction*, double, double*) + 528
55  QuartzCore                    	       0x19b100ff0 CA::Transaction::commit() + 680
56  AppKit                        	       0x196f7c54c __62+[CATransaction(NSCATransaction) NS_setFlushesWithDisplayLink]_block_invoke + 304
57  AppKit                        	       0x1976de4ac ___NSRunLoopObserverCreateWithHandler_block_invoke + 64
58  CoreFoundation                	       0x1942bbe4c __CFRUNLOOP_IS_CALLING_OUT_TO_AN_OBSERVER_CALLBACK_FUNCTION__ + 36
59  CoreFoundation                	       0x1942bbc98 __CFRunLoopDoObservers + 572
60  CoreFoundation                	       0x1942bb1d0 __CFRunLoopRun + 764
61  CoreFoundation                	       0x1942ba734 CFRunLoopRunSpecific + 600
62  HIToolbox                     	       0x19ce52f68 RunCurrentEventLoopInMode + 292
63  HIToolbox                     	       0x19ce52bf4 ReceiveNextEventCommon + 320
64  HIToolbox                     	       0x19ce52a9c _BlockUntilNextEventMatchingListInModeWithFilter + 72
65  AppKit                        	       0x196e11000 _DPSNextEvent + 844
66  AppKit                        	       0x196e0f8a4 -[NSApplication(NSEvent) _nextEventMatchingEventMask:untilDate:inMode:dequeue:] + 1332
67  AppKit                        	       0x196e019b4 -[NSApplication run] + 596
68  AppKit                        	       0x196dd3088 NSApplicationMain + 1064
69  Glyphs 3                      	       0x102267d78 0x1021e4000 + 540024
70  dyld                          	       0x1025e90f4 start + 520