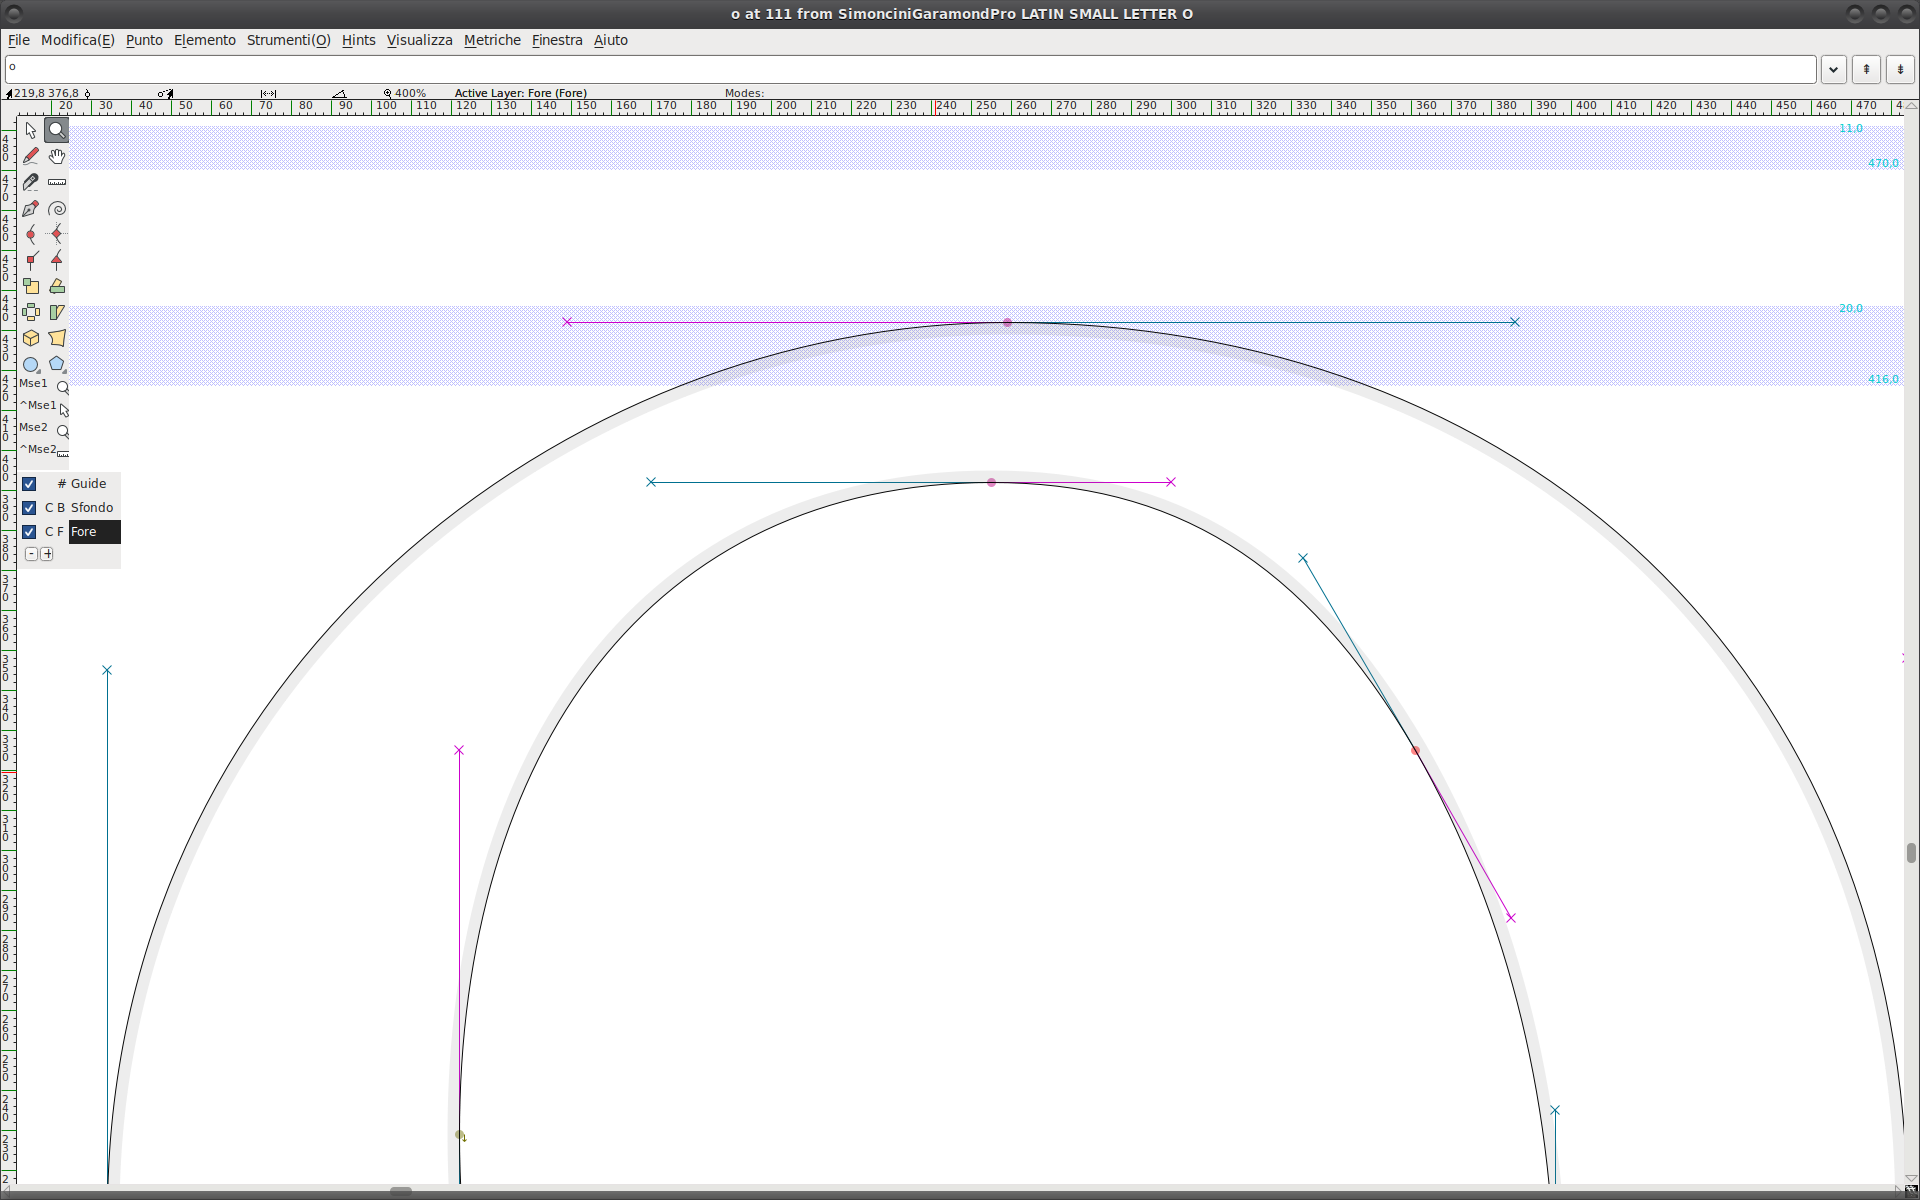
I have just started using Glyphs after a while on Linux I have always used FontForge, so I apologize if my question is very trivial. In FF I establish the x-height and the overshoot (similarly for the undershoot) and then I see the range: in the image I am attaching it is the blue-violet band. Is there a way to graphically highlight that range with Glyphs?
Thank you
Yes. Set your metrics in File > Font Info > Masters.
Found it!
However I need a further clarification (obviously, I have to operate a sort of “gestaltical switch” from one program to another).
I set the x-Height to 416 and the overshoot to 436. I find this data in the Alignement Zones (416.20), but in the Metrics - x_Height I find 423 0.
How is this 423 deduced?
At this point do I have to change the x-Height item by setting the original 416 and 436?
Thank you very much
How did you move your data into Glyphs?
The values in the metrics are alway the metric itself (x-height: 416) and the overshot as the width of the zone (20).
Simply, I opened the .otf with Glyphs.
But I don’t understand that 423 in the windows “Master - Metric”.
In the windows below, “Customized Parameters” it seems all ok.
Last: obviously, I obtain graphically the overshoot area only changing,
in “Master - Metric” the couple 423 0 to 416 436…
Can you send me the .otf file? (send it in a private message or by email to support at this domain).
I send you the zipped .otf with a PM.
Opening it with FF I don’t find trace of that 423 x-Height,
which on the contrary I find when I open it with Glyphs.
Thank you very much for your kindness and cooperation
I had a look at the file.
The x-height = 423 comes from the OS/2 table. And then it fails to connect the zone to the metrics as they are too different.
Ohh you’re right!!
I need to do a global re-examination of all the parameters …
Really a lot of thanks