A Glyphs.app plugin for visualising stroke uniformity.
The Callipers plugin helps you to visualize the thickness of strokes. If you are creating a low contrast font, you want to ensure that curves on the inside and outside of a stroke vary at the same rate, so that your stroke remains a consistent stem thickness throughout the curve. Presumably decent type designers can do this by eye, but I am not a decent type designer, and need help from a computer to tell me whether my stems have consistent thickness or not. That’s what the Callipers plugin does. This animation should be worth a thousand words:
First, select the Callipers tool from the tool bar. Then draw a line through the stem; this green line marks where the measurement will start. Then draw another line; the red one marks where it will stop. (If you don’t bisect exactly two curves, you have to do it again.) Then Callipers will show you your stem thickness: green marks areas of average thickness; redder areas are thicker than average and bluer ones are thinner than average.
Thanks for the explanation of the colors; I had been wondering how to interpret them since there was no explanation with the download. I understand it is pre-Alpha, but still…
As for drawbacks, if a user does not have View Interpolations turned on when the plugin is selected, the outlines disappear. Since View Interpolations isn’t a standard operating mode for me, it was at first confusing and not a desirable behavior. If you can make it work without View Interpolations turned on it might be better, but that’s just me; others may find it more useful the way it is.
That’s fantastic, I was looking for something like this for years. Just two things:
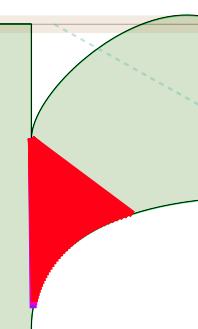
How does the plugin measure the distance? Shouldn’t it always choose to smallest distance between the outlines? (see image attached).
I would actually find it more useful if the plugin would show the exact development of the thickness of the stroke rather than average, thick and thin. This means, where is a change of the thickness? For instance, it could draw a red line when the stroke becomes thicker, and a green line when it becomes thinner. Problematic parts of strokes are usually subtle changes of thickness. A curves looks usually right, when there is a smooth transition from thick to thin. It looks wrong, when it’s not a clear transition, and when it changes several times from thick to thin. To prevent this, your plugin could be really helpful.
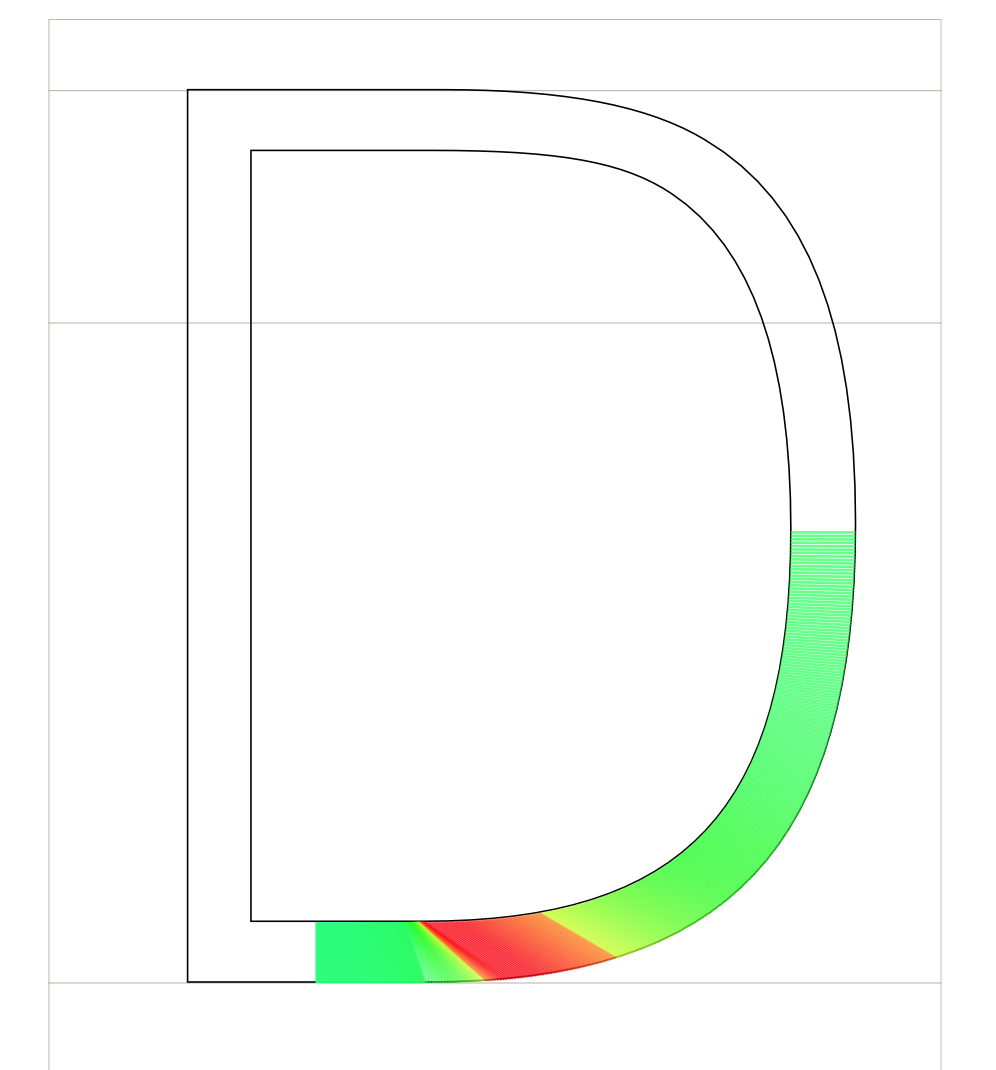
@Ludwig, thanks for the comments. I’ve changed things so that (a) it tries to find the shortest distance between the two outlines, and (b) variance in distance is shown as a smooth transition in color: green goes to yellow goes to red for “thicker than average”, and green goes to cyan goes to blue for “thinner than average”. I know this isn’t quite what you asked for - you basically want the rate of change of the thickness, not the thickness iteslf, but I think it gives you enough information. For example, in this glyph:
we see two problems. Obviously there is a bulge at the 1 o’clock position, but there is also a bluer portion between 11 o’clock and 12 o’clock where the curve thins and then thickens again.
I would calculate a certain number of evenly distributed points on both sides and then show the distances between them. The problem with Ludwigs example was a not linear distance distribution. Calculating the nearest points don’t work reliably as seen above.
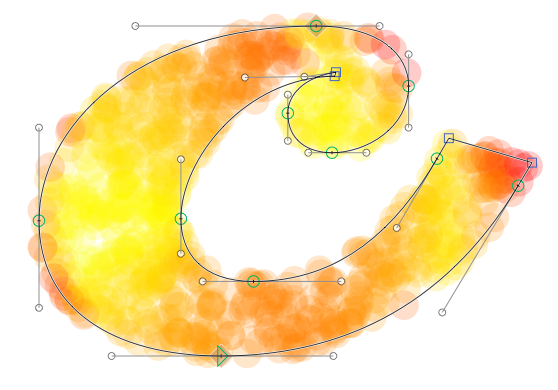
During my tests I thought it might be useful to be able to colorize the entire glyph, thereby displaying all of the stroke discrepancies at one time. The results were not what I expected.
If a user puts the reference lines at points outside a certain number of degrees (180+) it transposes the colors displayed to the outside of the path if the glyph is not completely enclosed. It happened during tests on two different shapes (a brush design /C and /O with an open gap) but at different degrees of separation of the references lines.
On a glyph that is completely enclosed (/o) it doesn’t display any color at all at around 185° but the closer one puts the second reference point past 180° to 0°, for example approximately 270°, it displays the colors on the opposite side of the glyph (between 270° and 0°).
These behaviors may be intentional or they may be something that cannot be resolved.
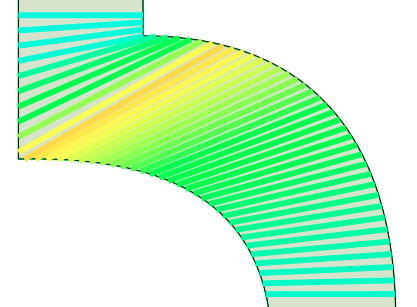
I think I’ve realised that both measurement methods have situations where they don’t work. @GeorgSeifert’s “corresponding point in time” method fails on curves like this:
Whereas @Ludwig’s “smallest distance between outlines” method fails on curves like this:
So the method you need will depend on the curve that you have. Therefore, I’ve created an options menu that will allow you to choose your measurement method. (And a few other things.) Please try beta 3: Release Beta 3 · simoncozens/Callipers · GitHub
I know the problem. This is how I tried to solve it at one point: Take a random coordinate inside the filled area. Measure in a number of directions to the closest intersections with the outline (decomposed & overlaps removed). Then, take the shortest distance measured and color a dot accordingly. This is what it looks like:
The problem is, inside a curve, close to the outline (like on the left or at the tip all the way to the right), you will always have very short distances. But I have found that it does not really hamper the overall impression. You can still tell the two thinnest parts of the letter. Perhaps I should leave out measurements very close to one edge of the outline, but far away from the opposite edge.
What kept me from developing it further is that, even after a few rounds of optimizations, it was still too slow for Python. Need to port it to ObjC at one point.
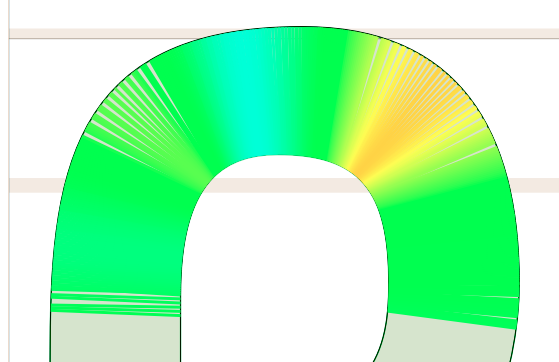
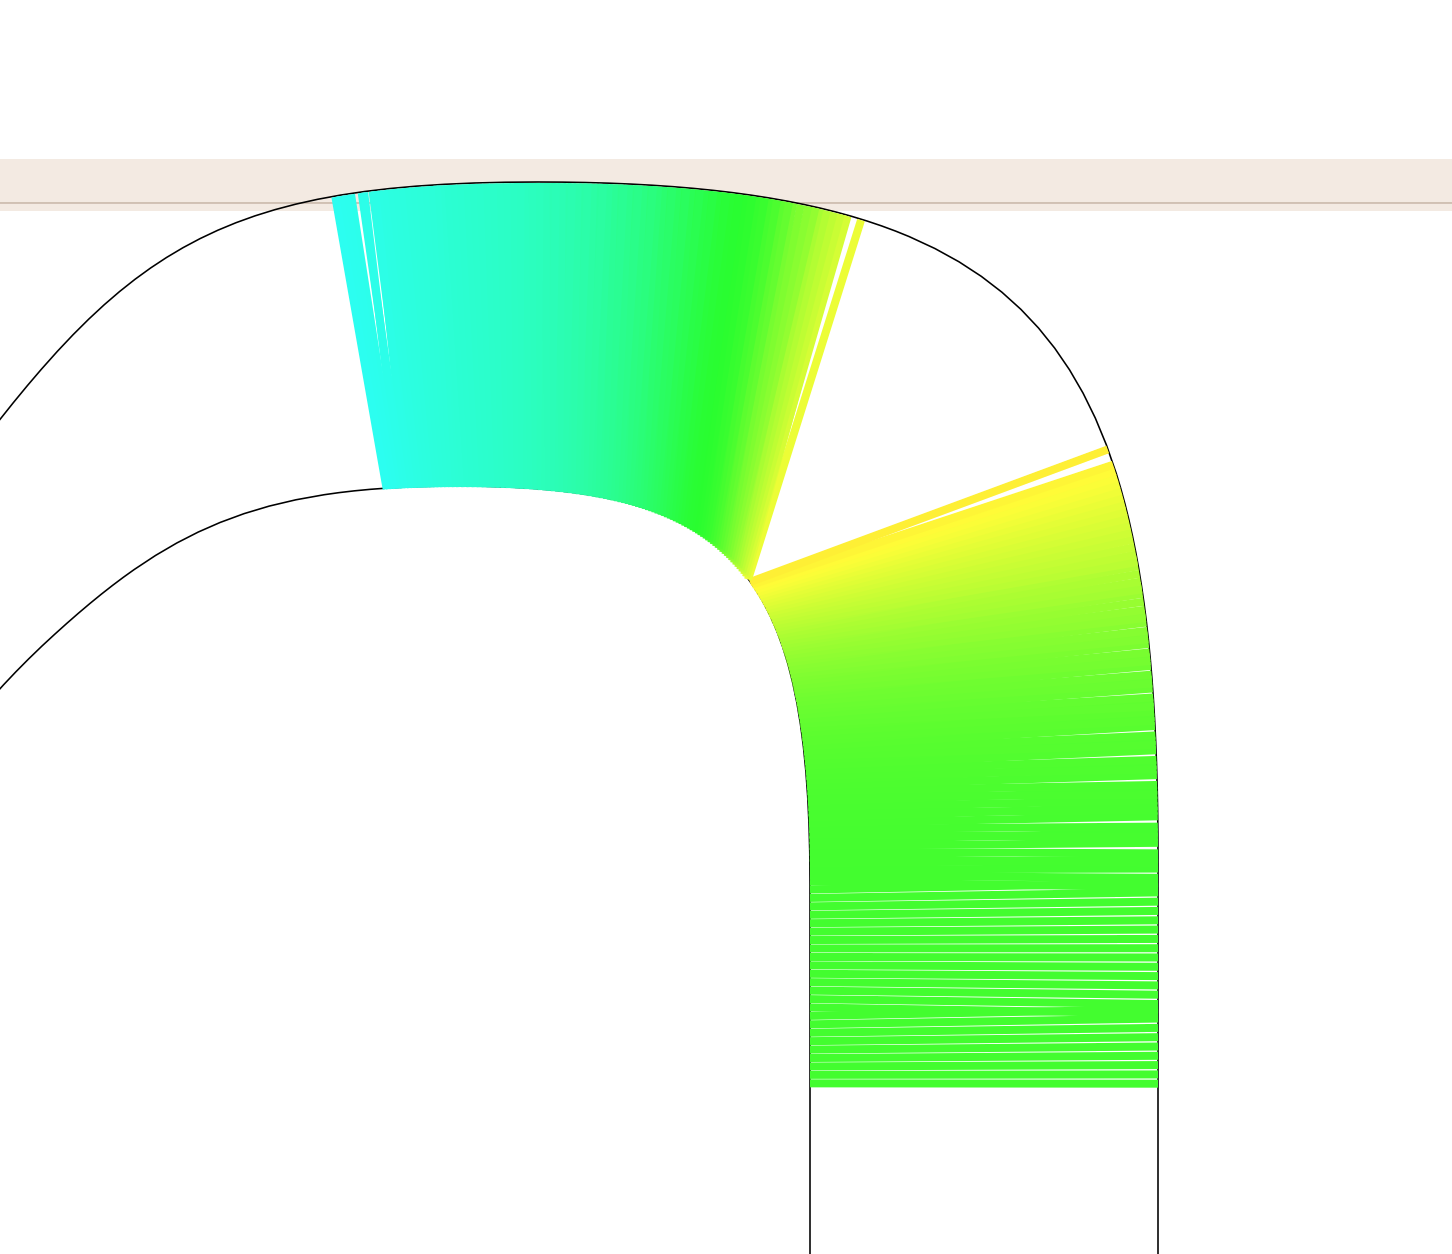
I think it’s great and it works very well. Is there also a way to do an entire glyphs, for instance the o (see comment before by @George_Thomas)? When testing there was only one unusual behavior (see image attached), but this doesn’t bother me too much.
@GeorgSeifert A while ago we talked about a program which could find the middle line of an outline. Would this be a way? Take the half of the distance lines, and theoretically you have the middle line, right? Now of course the problem is to draw this line with only the number of points the original outlines has …
OK, that unusual behaviour comes from the fact that Callipers is tracking the inner curve and finding corresponding closest points on the outer curve. It should always track along the longest curve. Please test beta 4: https://github.com/simoncozens/Callipers/releases/tag/beta-4
Is there is certain order how to place the reference lines? For instance I can’t get only the bottom curve of a o. It always chooses the top curve.
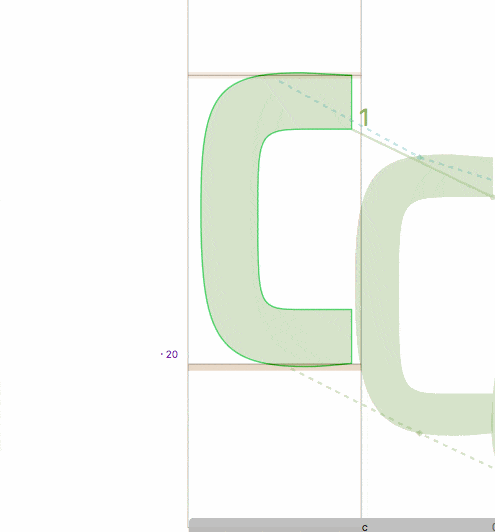
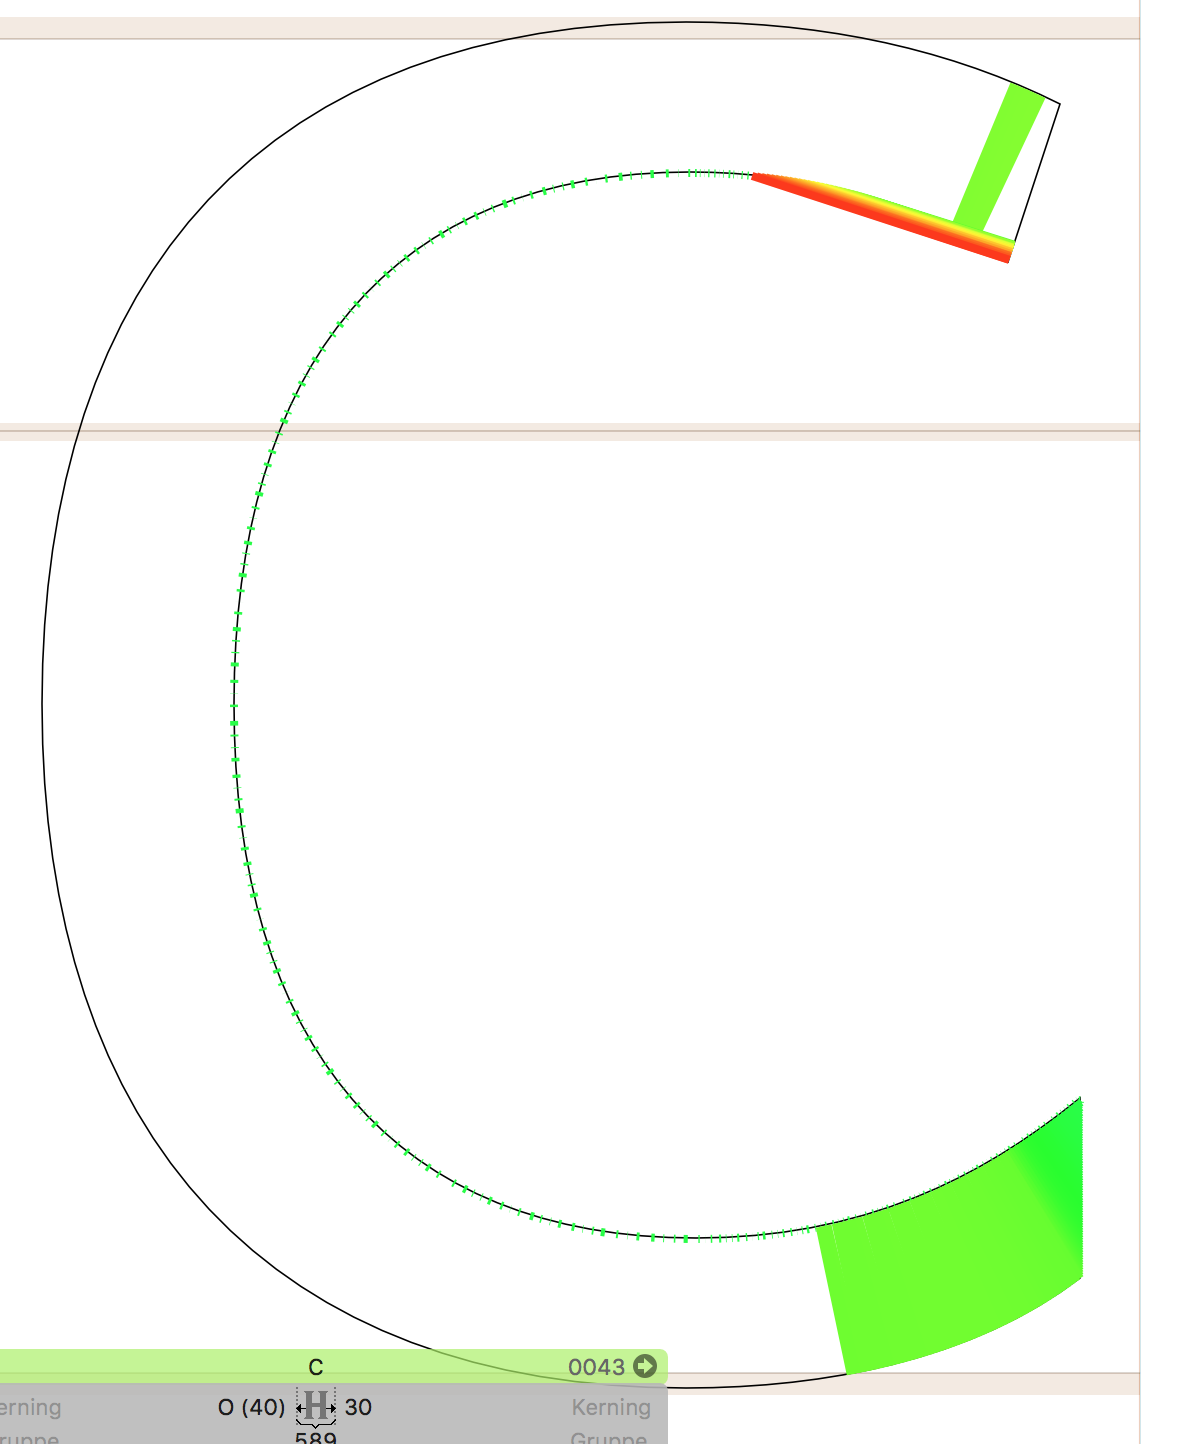
When I try to select almost the entire C, it gives me a strange output (see image). But maybe thats something that cannot be solved easily. Also, it’s not really a problem, because one always can select a smaller part of the curve.
I don’t know if it’s possible either. I think the way to do it would be to have the plugin be both a tool (so you can select the start and end points) and a reporter (so you can see the visualization while you move things). I don’t know how to do that. But I guess SpeedPunk does something like that, so it must be possible.
If any of the devs can chime in with hints about how to do it, I would be open to making it do that.
Is Callipers running fine with Glyphs V. 2.33 ?
By choosing the tool I lose the drawn paths; though I can get the “Rainbow” color indicator!
Hence by moving to another tool or by pressing Space bar on the keyboard, the Rainbow disappears and the paths are back.
Just wondering if I miss something here in order to have both: the color indicators and paths showing simultaneously ??
I want the floating window to automatically appear when I select the tool (which is what it does) and automatically close when I choose something else (it doesn’t). I don’t think it needs to have a close box. I don’t know if you have SpeedPunk, but that’s a good example.
 I think the way to do it would be to have the plugin be both a tool (so you can select the start and end points) and a reporter (so you can see the visualization while you move things). I don’t know how to do that. But I guess SpeedPunk does something like that, so it must be possible.